High-Performance Liquid Chromatography (HPLC) is a powerful analytical technique used to separate, identify, and quantify individual components within a complex liquid mixture. While techniques like gel electrophoresis rely on molecular size, HPLC uses a liquid stream to push a sample through a specialized column, separating compounds based on their chemical interactions with the column material. It is the gold standard for quality control in pharmaceuticals, environmental monitoring, and food safety.
How HPLC Works
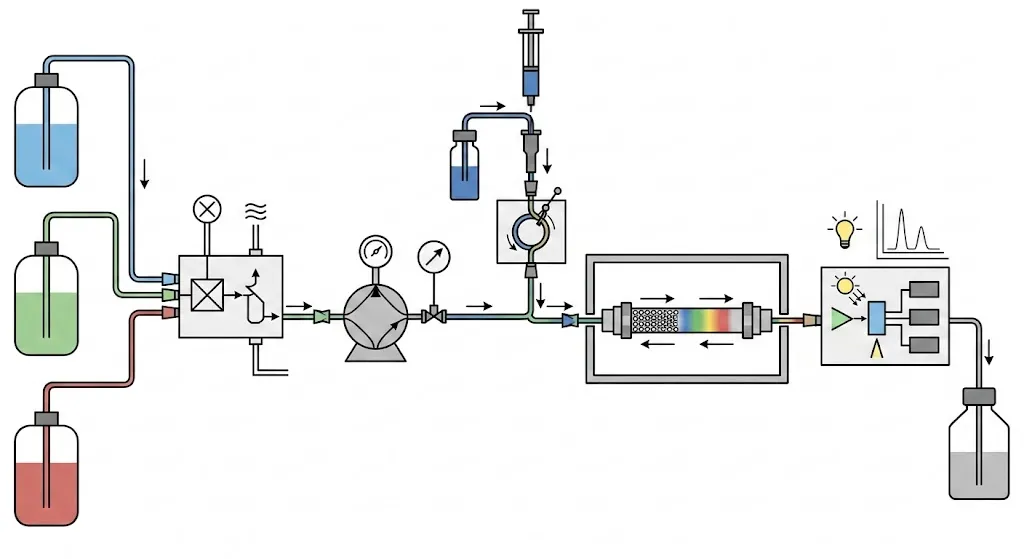
To achieve such high precision, the system follows a strictly controlled path through several specialized parts:
- Mobile Phase Reservoir
These bottles hold the solvents (the “mobile phase”) that will carry your sample through the system. Think of this as the liquid conveyor belt that keeps everything moving.
- Degasser
Before the liquid reaches the pump, it passes through the degasser. This removes dissolved gasses from the solvents. Even a tiny air bubble could cause pressure fluctuations or “noise” in your data, ruining the experiment.
- Pump
The pump is the heart of the system. It creates a constant, steady flow of the mobile phase under very high pressure—often hundreds of times atmospheric pressure—to force the liquid through the tightly packed column.
- Injector / Autosampler
This is where the “magic” begins. The injector introduces a precise, tiny volume of your sample into the high-pressure stream of the mobile phase.
- Column in an Oven
The column is the “brain” of the separation. Inside, the sample components interact with a solid material (the stationary phase). Some components stick to the material longer than others, causing them to exit the column at different times. The oven keeps the temperature constant to ensure the results are reproducible.
- Detector
As the separated components emerge from the column one by one, the detector “sees” them. It senses changes in properties like UV light absorption or fluorescence and sends an electrical signal to the computer.
- Data System
A computer records the detector’s signals and generates a chromatogram—a graph with peaks that represent each separated substance. By looking at the height and timing of these peaks, scientists can tell exactly what is in the sample and how much is there.
- Waste Container
Once the sample and mobile phase have passed through the detector, they are collected in a waste bottle for safe disposal.